


Definitions can really matter.
Ask most people what they mean by saving, and they will probably think of something along the lines of the net (or perhaps gross) acquisition of financial assets - flows in and out bank accounts, and their net purchases of stocks and shares, credits and government bonds. Pensions may not be included, if they are not purchased by them directly.
But that is NOT what household saving is, in the sector accounts.
In fact, on the definition above, expressed as shares of disposable incomes, UK households would always “save” more than their German counterparts, a result that many people would probably have problems getting their heads around.
From long experience, mention this in a meeting in Frankfurt - but thankfully, not at the ECB or the Bundesbank - and you will immediately lose half of the audience (they would think you were talking nonsense).
Care is also needed when doing international comparisons of household saving ratios, especially if being used as an argument for making an investment decision, or the potential for one country to outperform, or underperform, another.
In the US, for example, disposable incomes are measured net of capital depreciation, here in the UK, or Europe, they are typically shown gross.
The household sector includes a lot of unincorporated businesses and farms, with a lot of capital equipment, which overtime depreciates in value.
Why does any of this matter?
Because last week saw members of the BoE’s MPC giving testimony to the UK Treasury Select Committee. One of the risks singled out by the BoE (why growth could surprise on the upside, or downside) was the potential for the saving ratio to fall (or rise) by more than expected.
But the whole discussion at the Treasury Select Committee was all framed in terms of why households had, in aggregate, decided to save more.
Nothing was mentioned about what, at key points in the economic cycle, has often actually caused big swings in the UK saving ratio, causing GDP to surprise on the upside (when the saving ratio falls), or downside (when it rises). Historically, this wasn't significant shifts in the UK household sector’s net acquisition of financial assets.
In that sense, the testimony may have further reinforced some people’s misperception of what actually determines the saving ratio.
More on this the other side of the paywall.
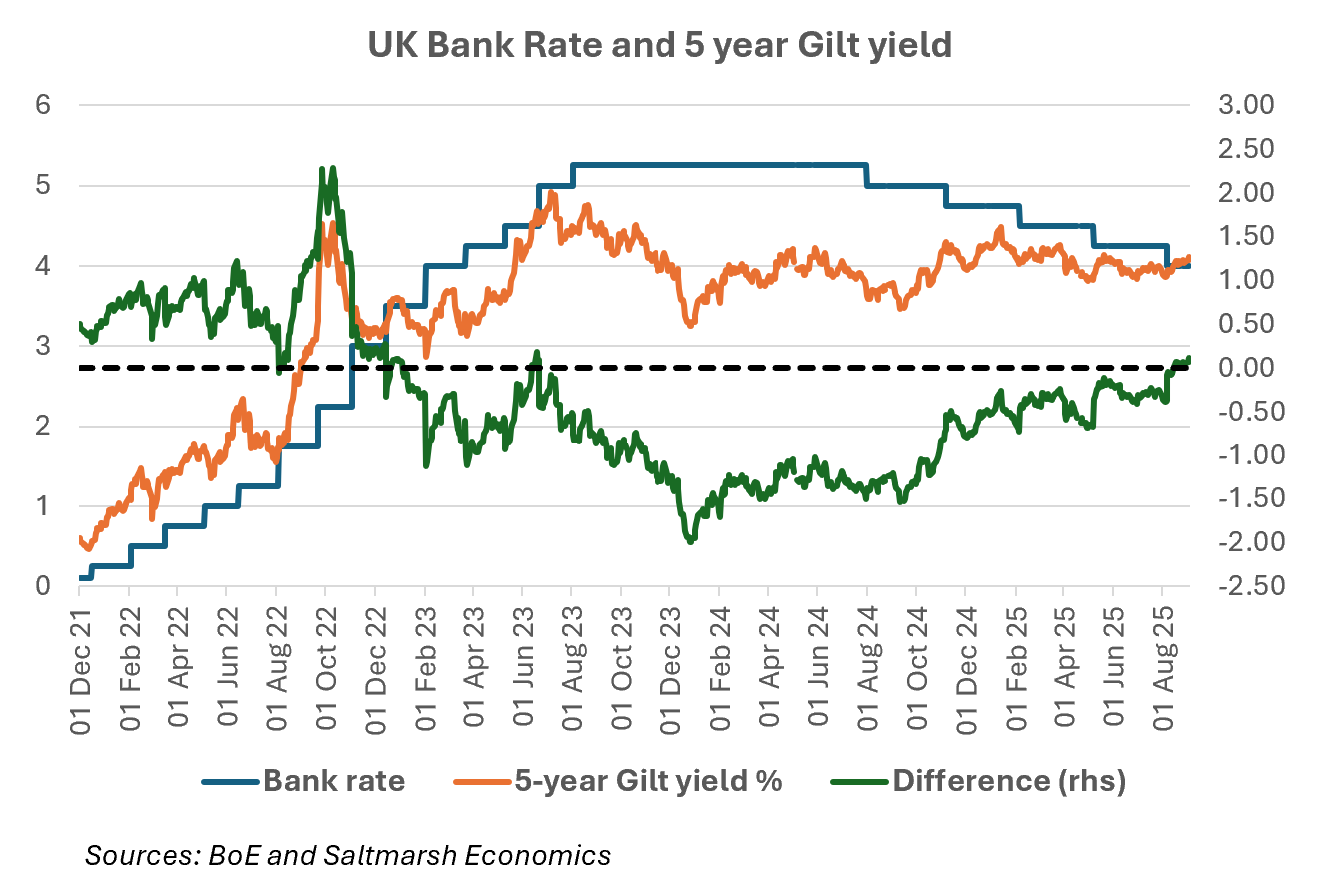
Before this, one other quick observation from the testimony by the BoE last week, the focus on the 5-year, not 30-year part of the UK Gilt curve.
It is certainly true that the 5-year part of the curve (which matters more for economic activity) has been more anchored than the 30-year (which now sees less demand from UK investors, giving the closing of defined benefit pension schemes) to the Bank Rate.
Moreover, it should also not be forgotten that UK Bank Rate (that the Gilt curve is anchored from) stands 200 basis points higher than the ECB’s official policy rate - a point made by the Governor.
But one point we would make is how much the 5-year point of the curve has moved relative to the Bank Rate, as the markets have become less and less convinced of the potential for further rate cuts.
This should come as little surprise (see our recent posts here and here on food price inflation, both in the UK and Europe, another thing for policy makers to now worry about).
But now back to what actually determines the UK saving ratio.
Keep reading with a 7-day free trial
Subscribe to Saltmarsh Economics to keep reading this post and get 7 days of free access to the full post archives.