

Building blocks of European inflation
Watching the Tides - Marchel Alexandrovich

As we outlined in our most recent post on the UK economy, higher food price inflation is now squarely on the Bank of England’s radar (see here). Specifically, the BoE is focused on the link between food price inflation and households’ inflation expectations, and what dislodged expectations could mean for future wage settlements and inflation persistence.
In the euro area, the weight of food and non-alcoholic beverages in the inflation basket is even higher than in the UK: close to 16%, compared to 11%. So, although at the moment headline inflation in the euro area is precisely at the ECB’s target and the process of disinflation has been much more rapid than in the UK, both central banks will be thinking about where the new normal for the various sub-components of inflation is likely to be over medium term.
For those who monitor these things closely, in Europe, this topic was first raised by the ECB’s Isabel Schnable in a speech more than three years ago, when she coined the terms “Climateflation”, “Fossilflation” and “Greenflation.” At the time, in early 2022, just after Russia’s invasion of Ukraine, the main story was the surge in energy prices. However, Schnabel’s speech began by highlighting the link between climate change and food inflation, noting that, “as the number of natural disasters and severe weather events is rising, so is their impact on economic activity and prices. For example, exceptional droughts in large parts of the world have contributed to the recent sharp rise in food prices that is imposing a heavy burden on people who are struggling to make ends meet.”
In short, long before it became a mainstream topic, the ECB was starting to make the case for a structurally higher rate of inflation in the euro area because some components of the inflation basket - such as food - were likely to reset to higher ‘new normal’ rates.
In terms of the here and now, this week’s breakdown shows euro area inflation at 2.04% YoY in July. Yet it’s also worth noting that each of the four main components of headline inflation - services (at 3.2% YoY), non-energy industrial goods (at 0.8% YoY), energy (at -2.4% YoY) and food (at 3.3% YoY) - is at least a full percentage point away from the ECB’s 2% target, highlighting the delicate balance that produces the aggregate number.
Euro area inflation by category (weight of component in bracket)
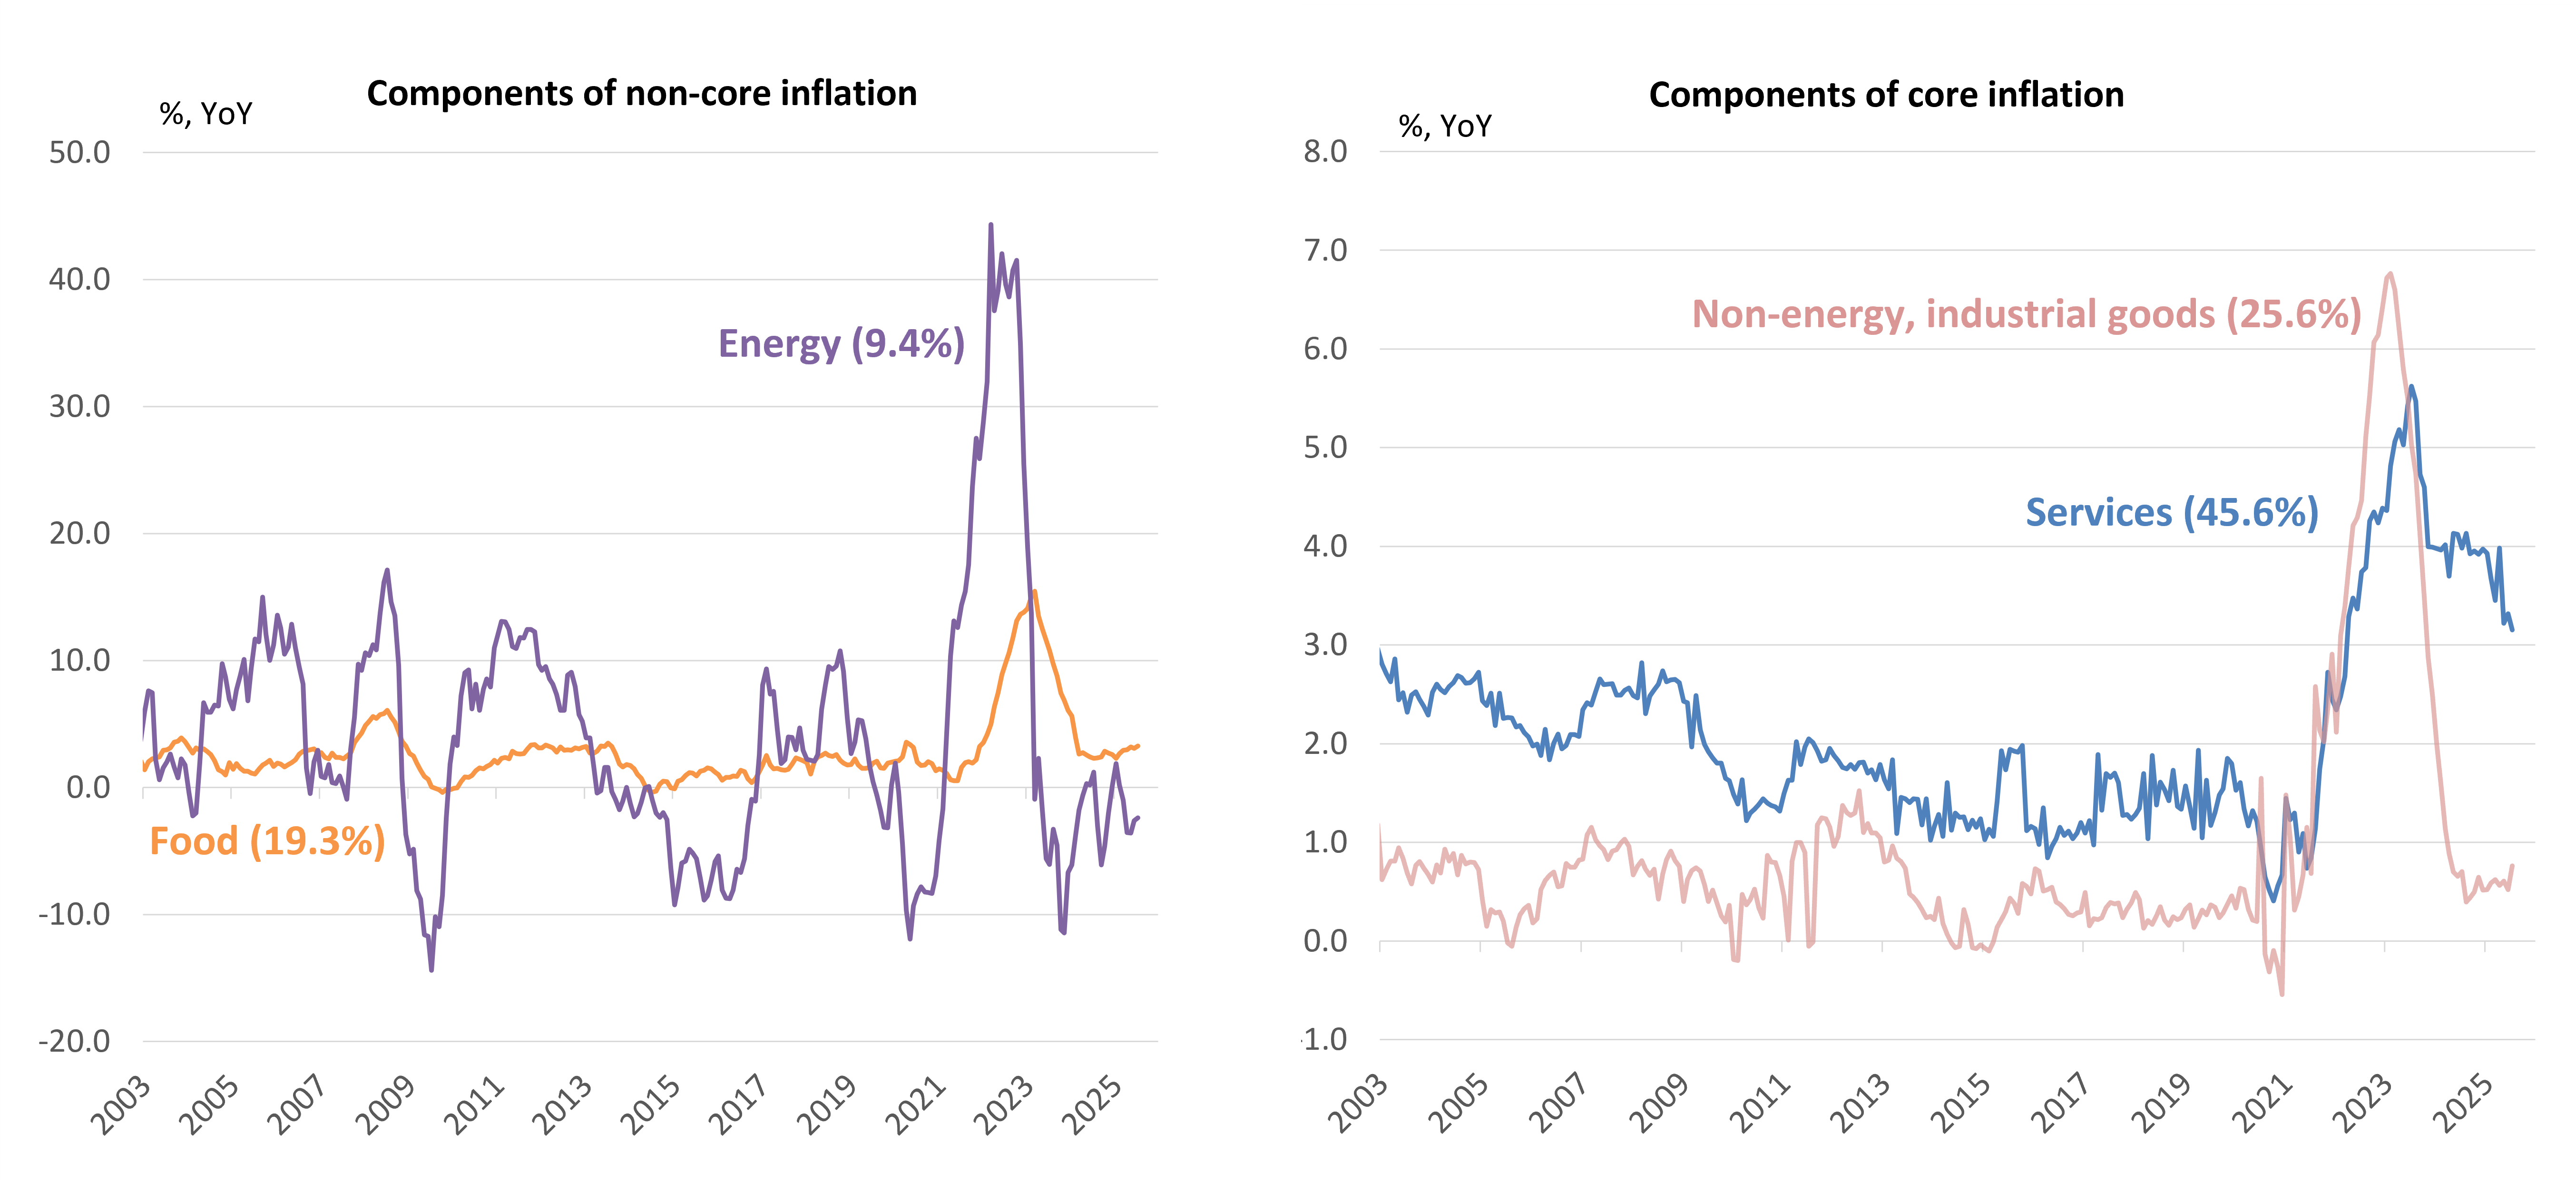
Source: Eurostat and Saltmarsh Economics
Coming back to food inflation, since the start of 2020, the UK and the euro area have seen an almost identical surge in prices: 37% for the UK vs 33% for the euro area (see first chart below). But as David highlighted in his post, the UK’s experience feels different, because over the last decade UK food price inflation ran consistently below the headline rate of inflation. Whereas in the euro area, food inflation more or less tracked the headline rate (see second chart below). And, perhaps, it is this shift in the relative inflation rates that is catching UK consumers off guard - even though, in absolute terms, their experience is not really all that different from what is happening on the continent.
Index of prices for “food and non-alcoholic beverages”
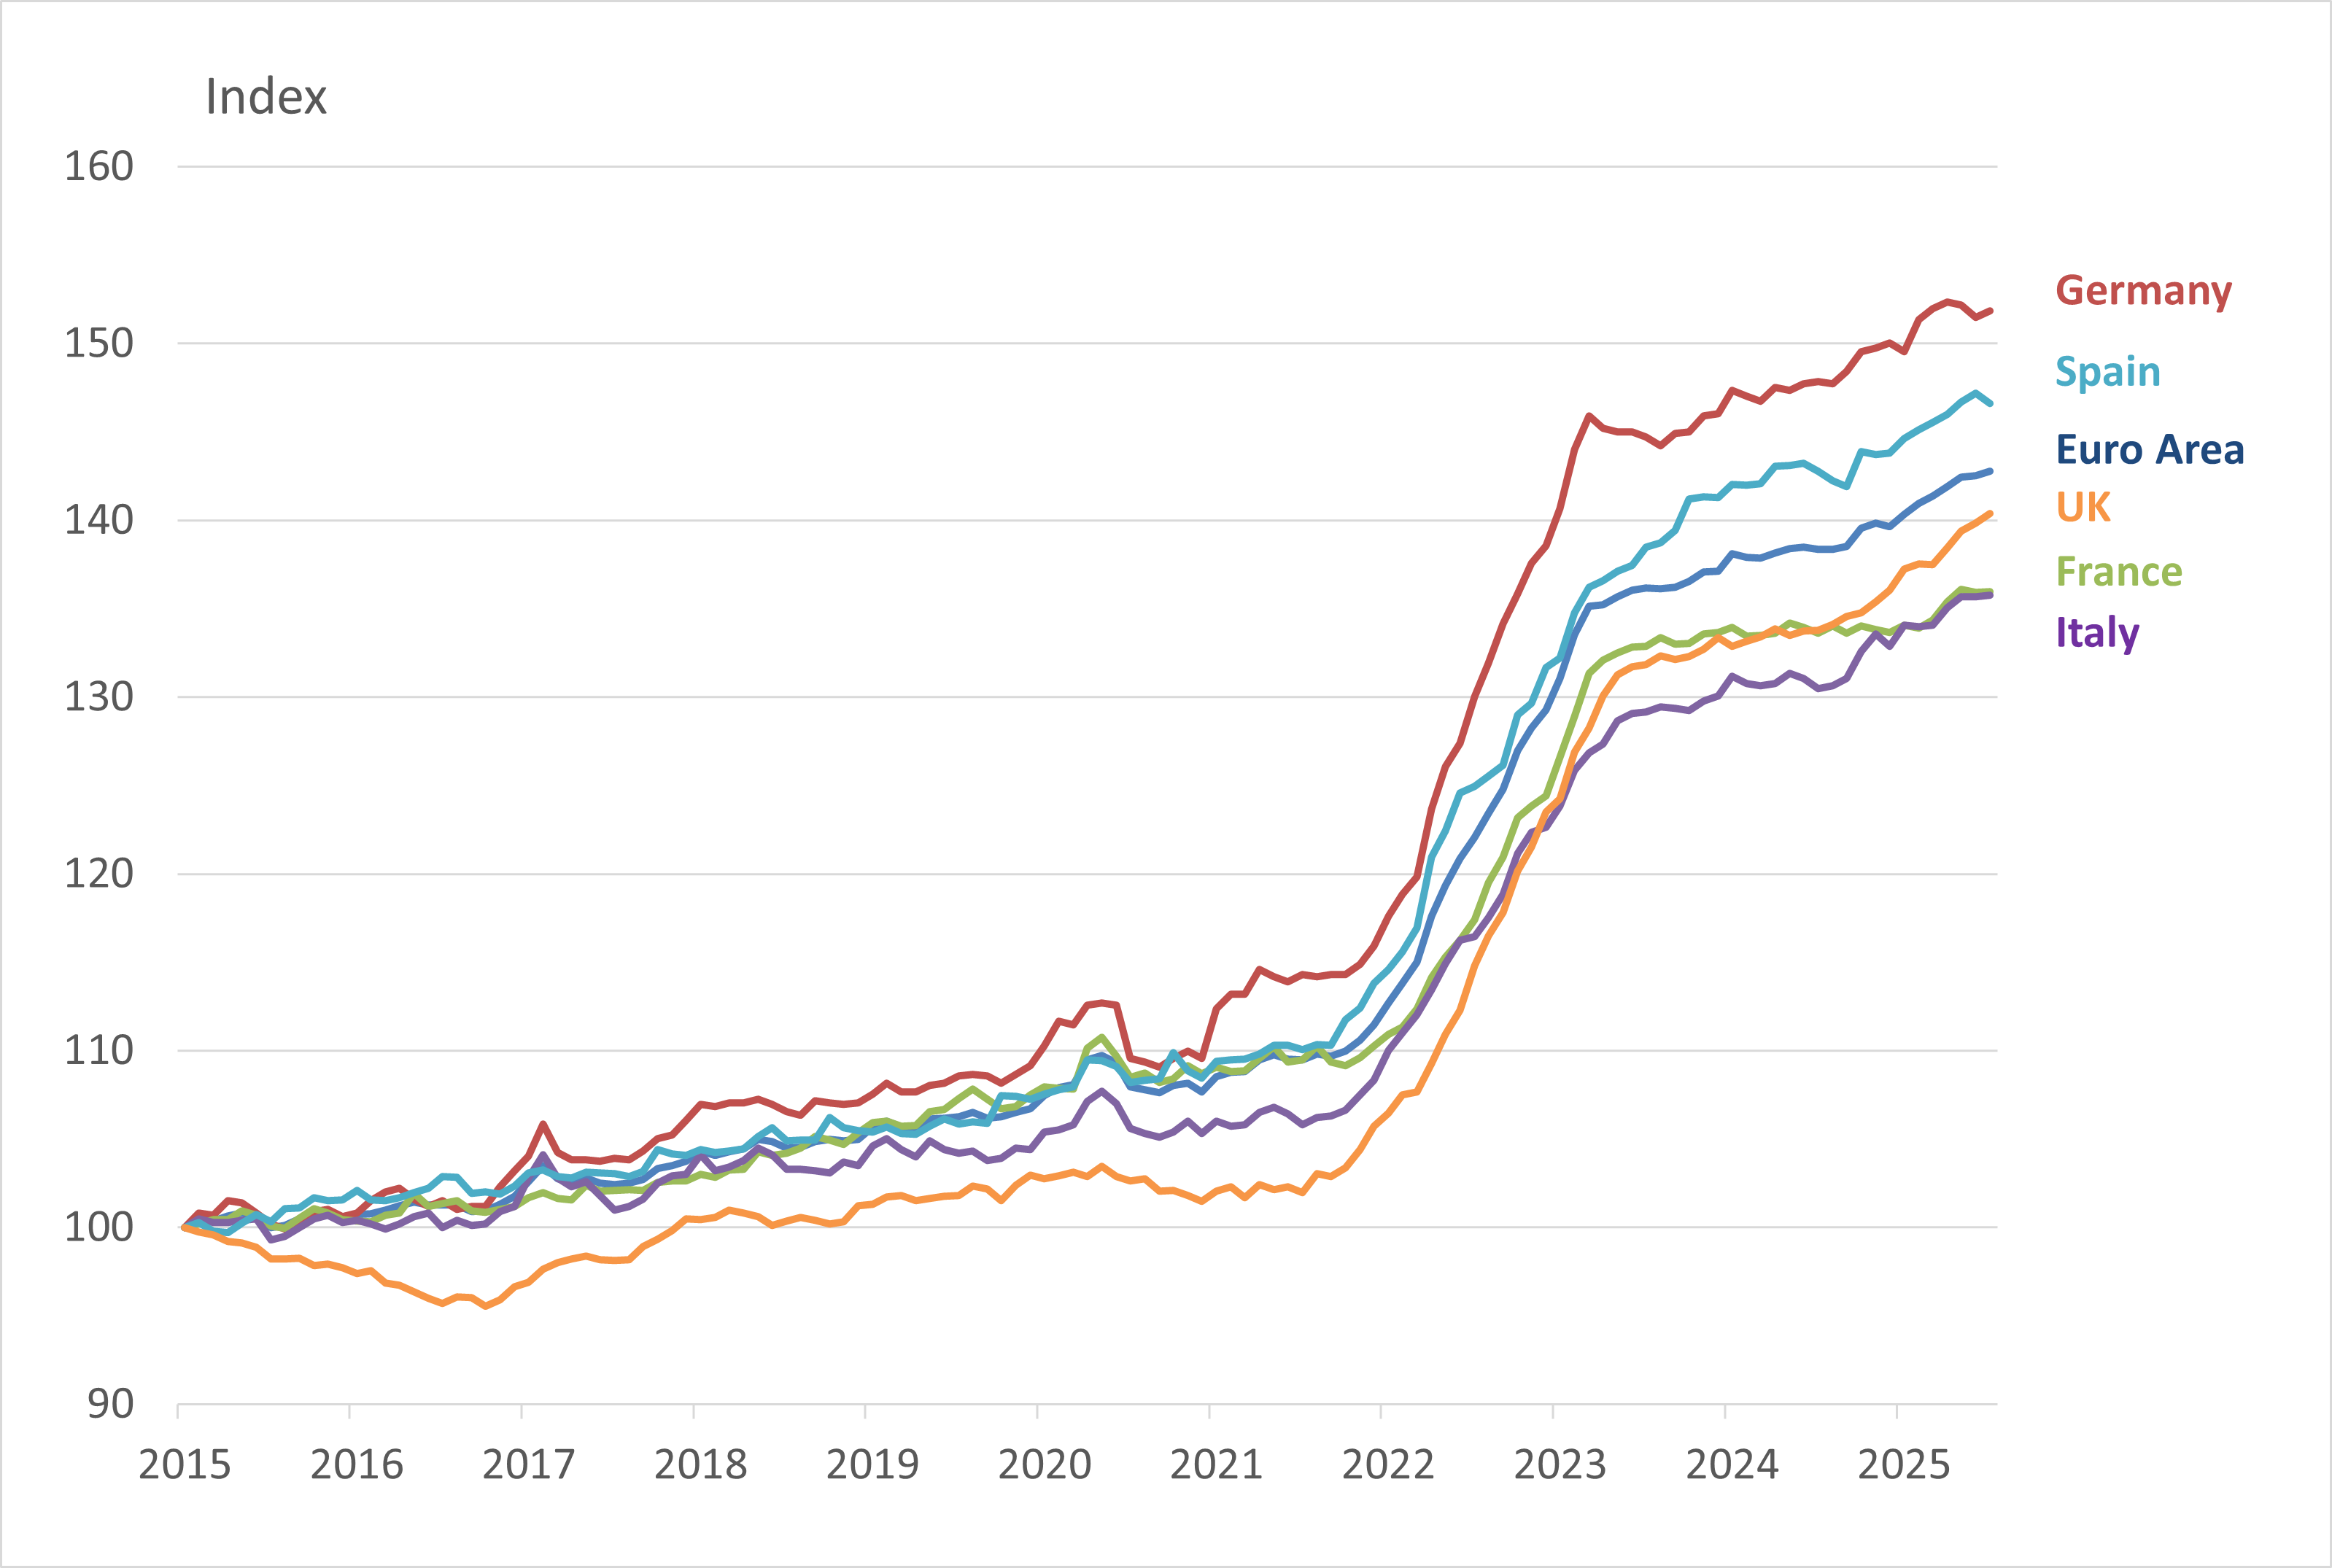
Source: Saltmarsh Economics
Difference between food inflation and headline inflation (HICP/CPI) in the euro area and in the UK (3-year moving average)
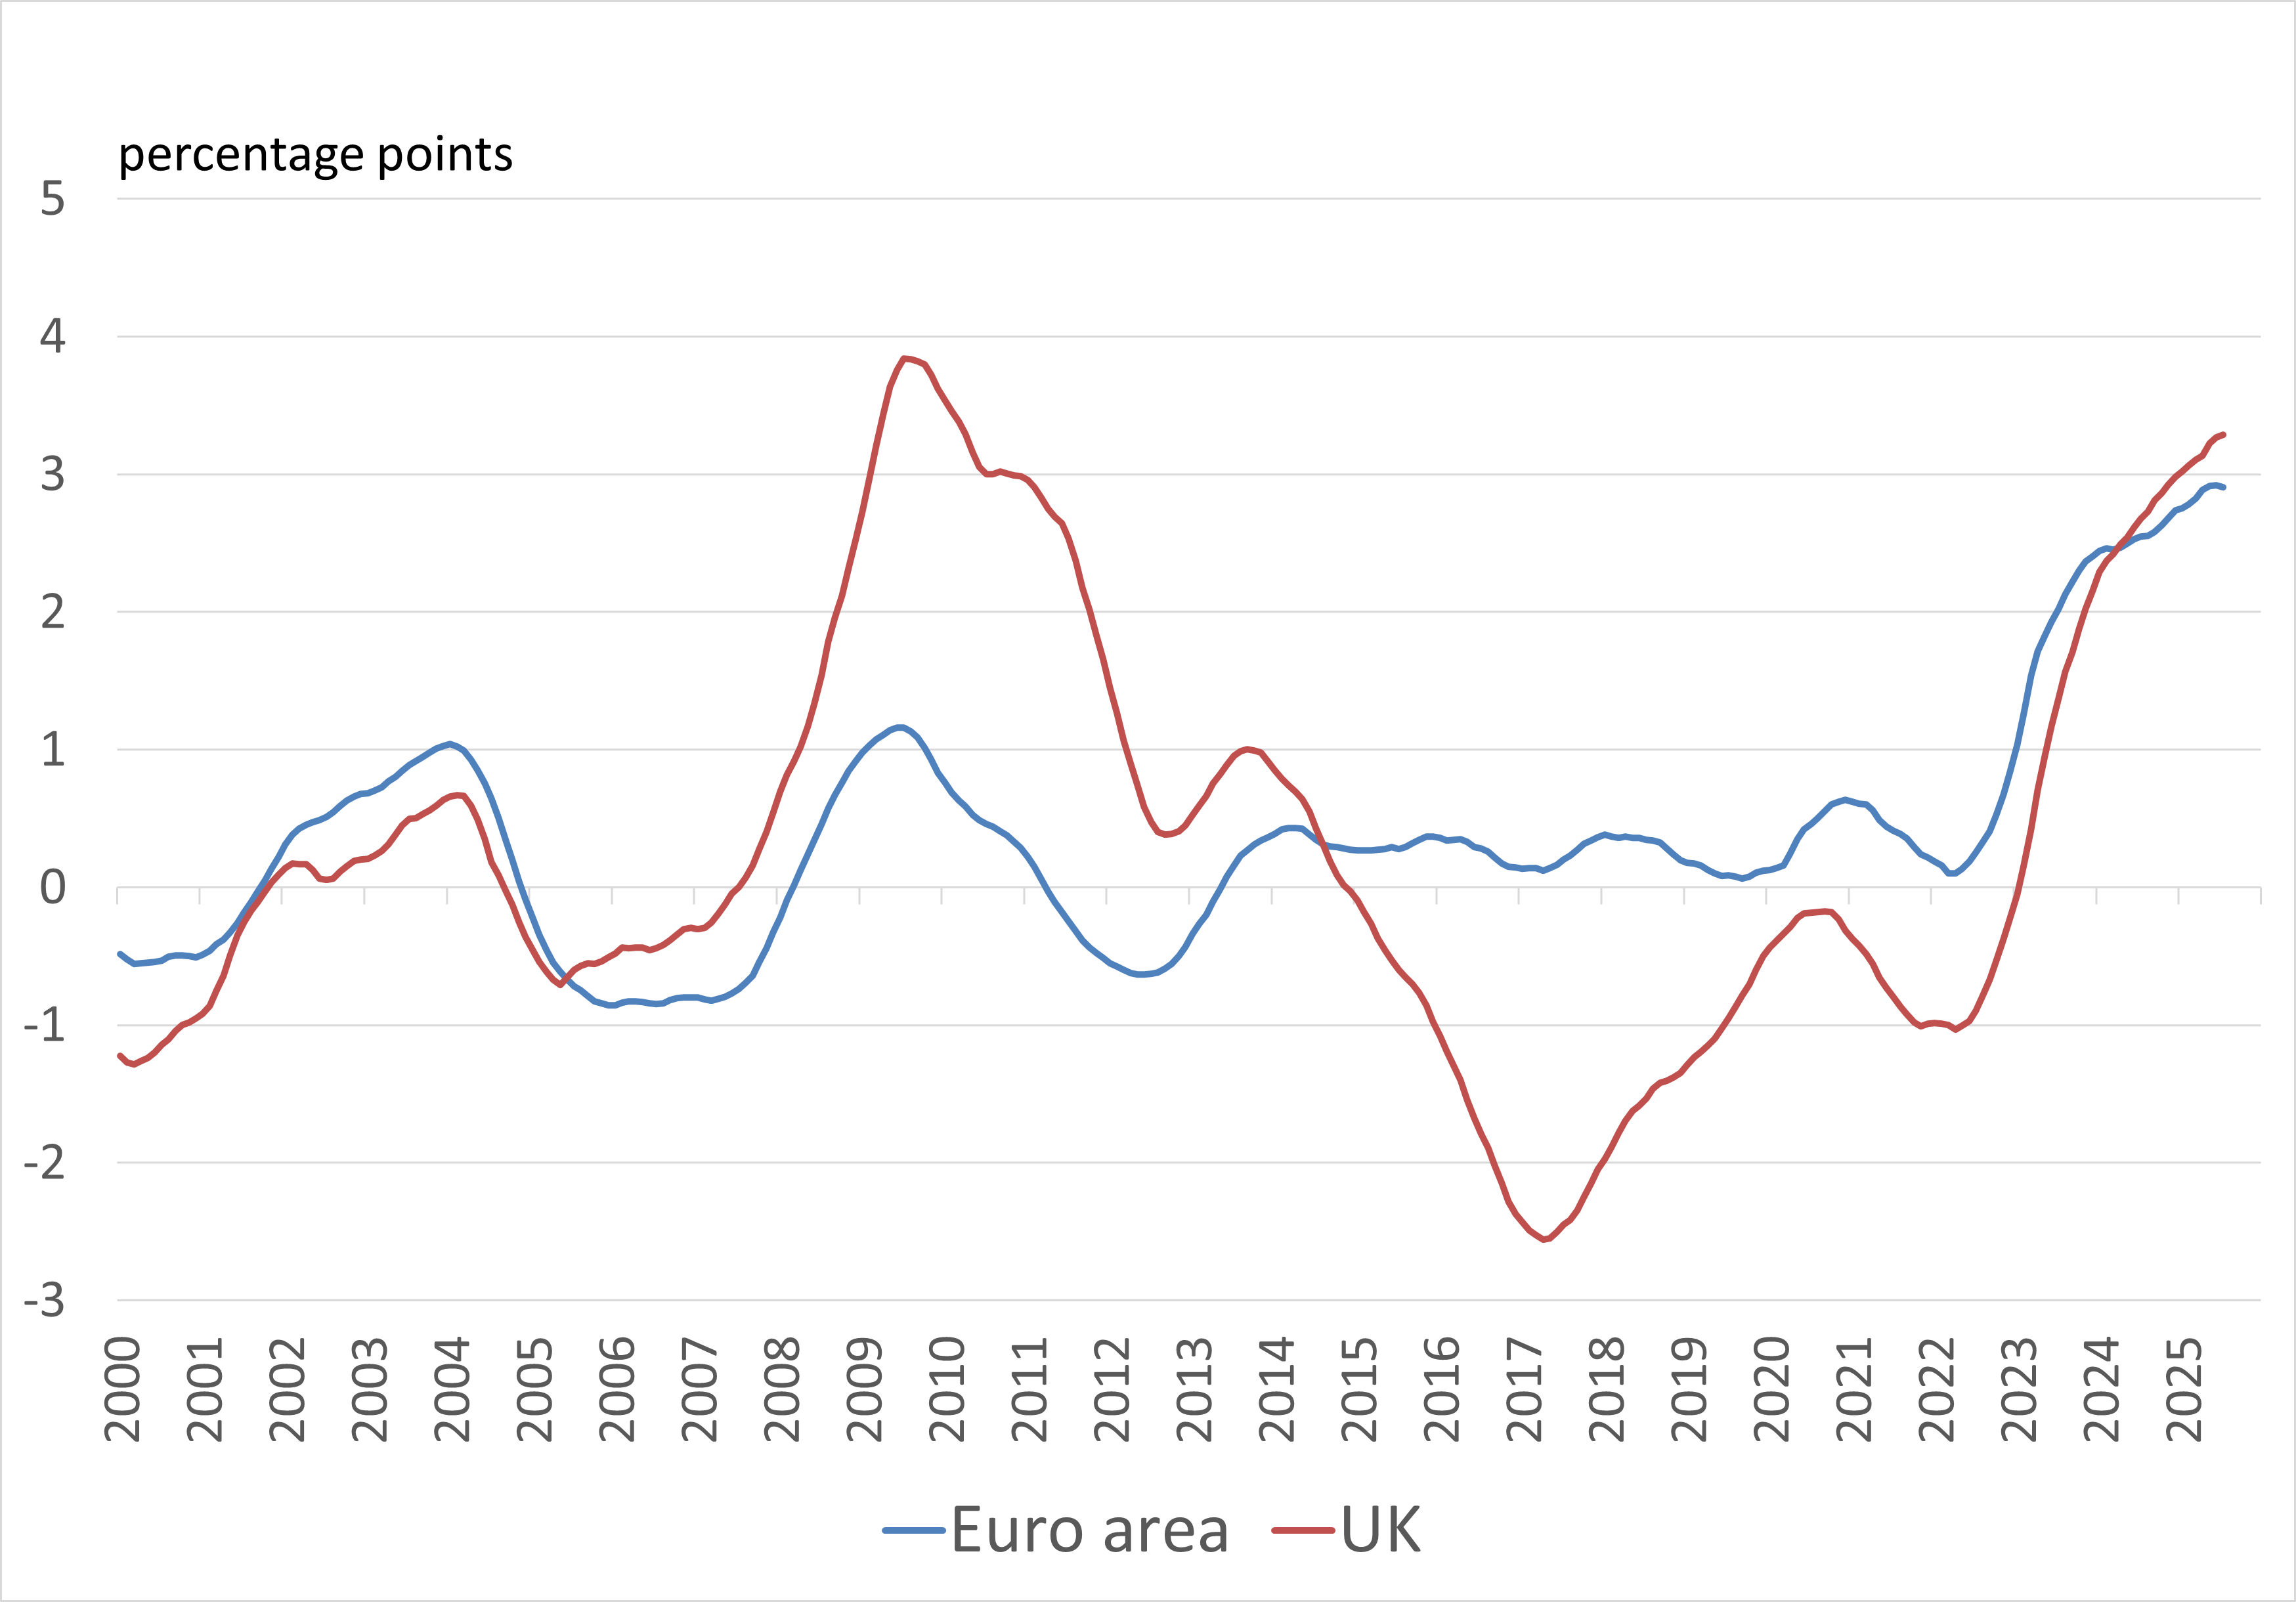
Source: Saltmarsh Economics
Finally, given that it echoes our own analysis, we enjoyed seeing the following chart in the latest BoE’s quarterly Monetary Policy Report which shows the extent of inflationary pressures across the various components of the UK’s inflation basket. And, the BoE’s conclusion - “as inflation rates remain elevated across a large share of the services CPI basket, the expected slowing in inflation will require a broad-based change in price setting across the whole services sector” - aligns with our own thinking on the stickiness of UK inflation.
Our own analysis of the latest euro area data tells a similar story - inflation trends are improving (fewer components of the core inflation basket are registering inflation rates of above 3% YoY, for instance) - but we are not yet back to normal dynamics.
Weighted share of services subcomponents in the UK with inflation rates over 1 percentage point above their 2012–19 averages
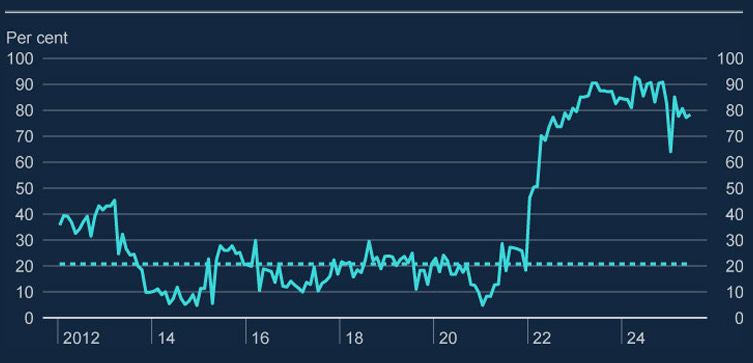
Source: Bank of England
Share of euro area’s core inflation basket with inflation rate above 2% YoY, above 3% YoY, above 5% YoY
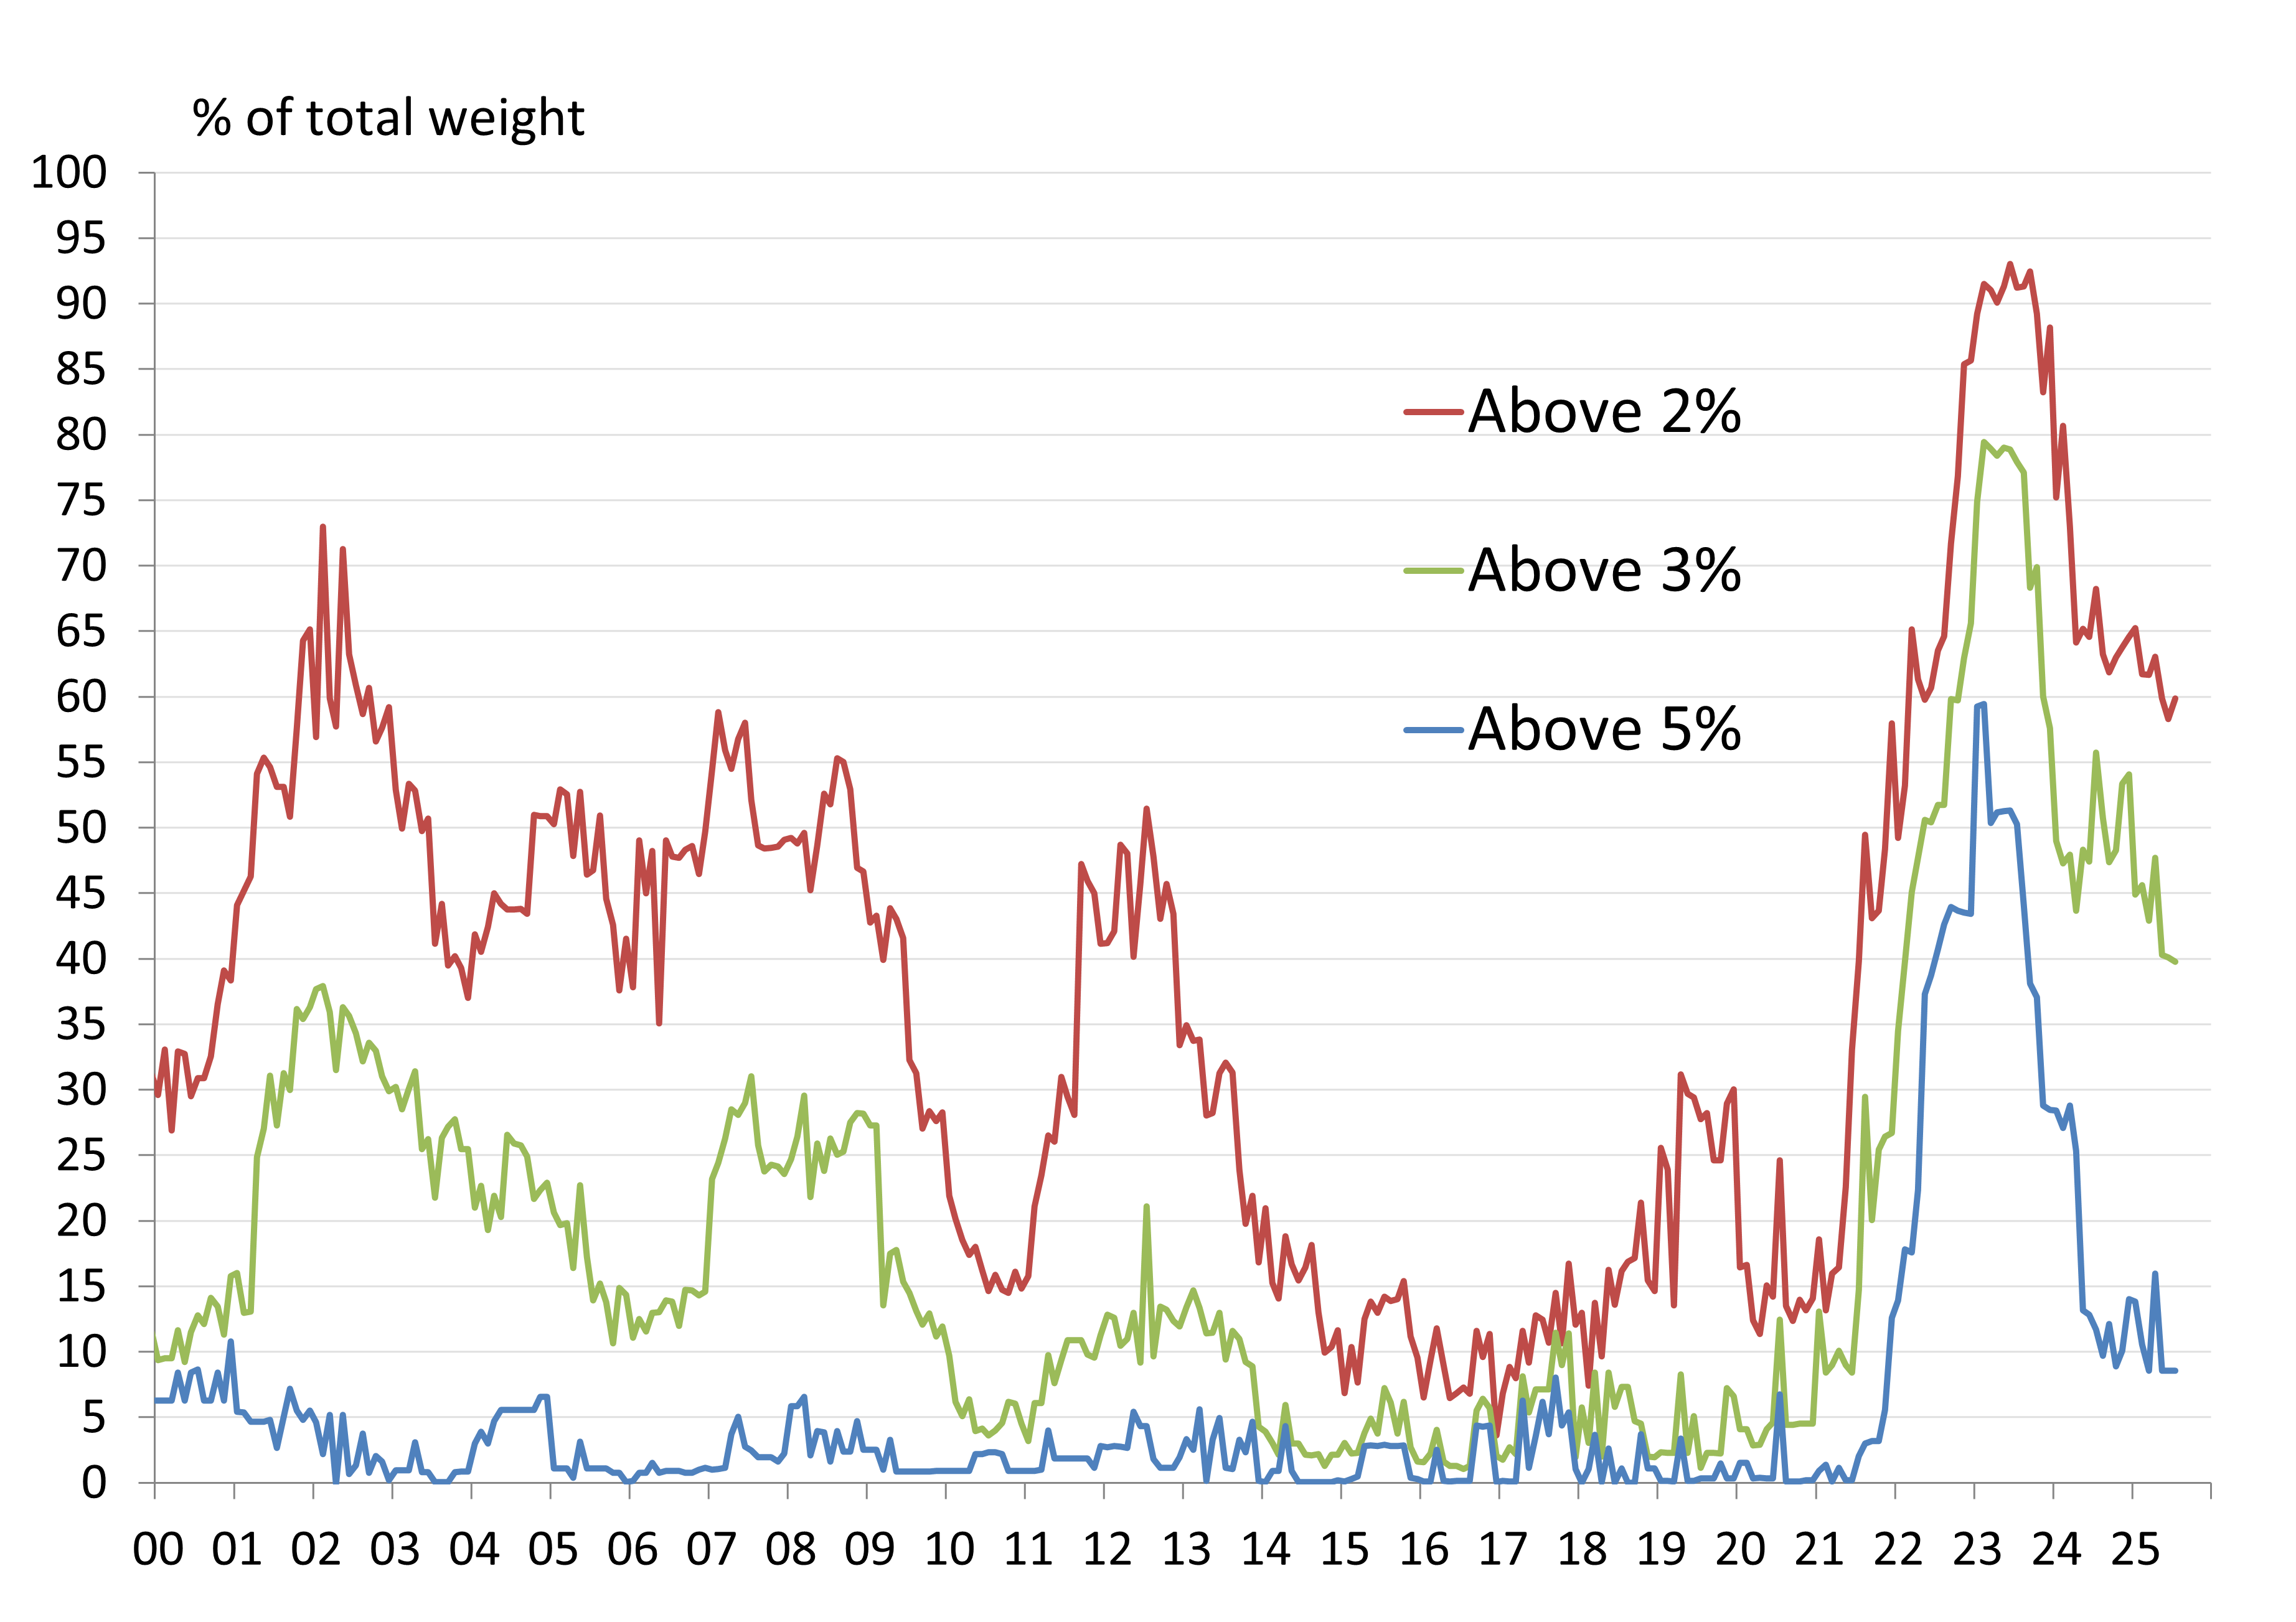
Source: Saltmarsh Economics
This Substack is reader-supported publication, please consider becoming a paid subscriber. And reach out if you are interested in receiving our more detailed research on the BoE, the ECB and climate change, including details of our very own Saltmarsh Economics Climate Index (SECI), that scores and ranks sovereigns on climate risk grounds.
© 2025 Saltmarsh Economics Limited company Number: 13681146
Registered Address: Zeeta House 200 Upper Richmond Road, Putney, London, United Kingdom, SW15 2SH